The Circular Economy for Wastepaper
Key players across the wastepaper industry are likely to see their operating models challenged in coming years as significant regulatory changes regarding the permitted use of wastepaper come into play globally. Governments are hoping to create stronger recycling markets, with landfill becoming increasingly discouraged and waste recovery technology investment accelerating. As a result, participants across the market are facing a range of challenges and opportunities.
In this article we take a look at the major trends and challenges facing participants across the wastepaper space.
Wastepaper Trends and Insights
1. Population-Based Growth in Wastepaper Volumes
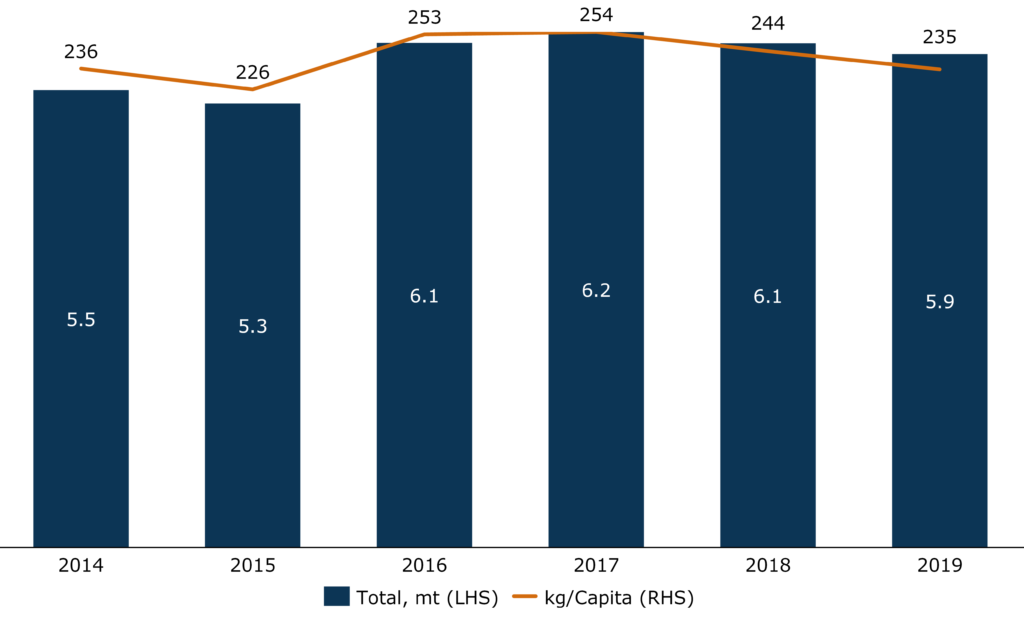
5.9mt of wastepaper was generated across Australia in 2019, a figure that has remained relatively flat since 2016. On a per-capita basis wastepaper generation declined to 235kg/capita in 2019, and while this is encouraging, governments remain concerned with the gross volume of waste expected to be generated in the future. As the population continues to grow, so too will gross waste volumes, and therefore the importance of recycling.
Wastepaper Generation, Australia
2. Recycling Rate Improvement
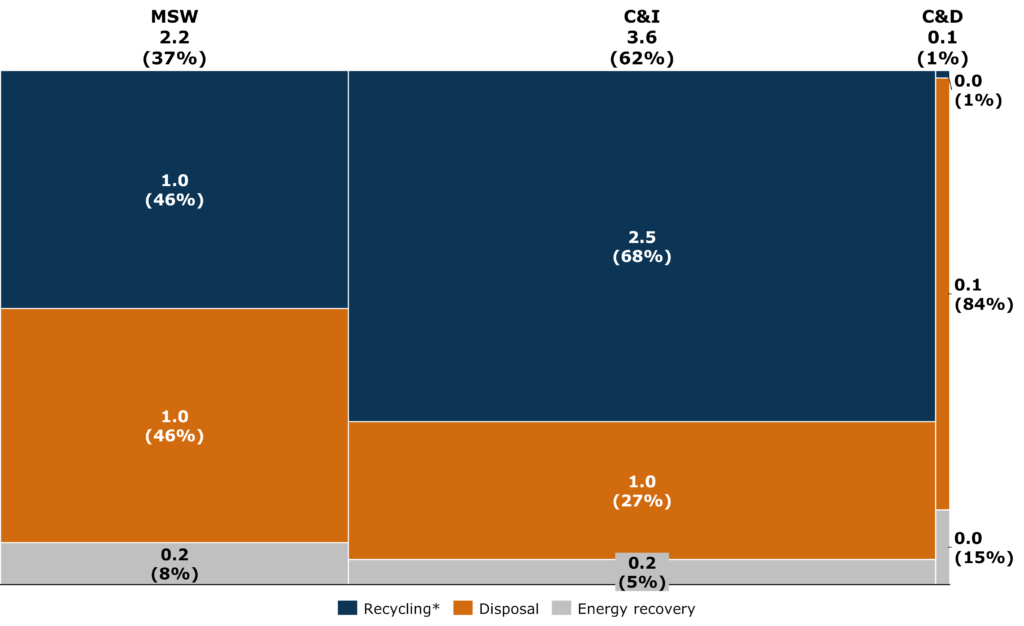
Of the 5.9mt of wastepaper generated in 2019, approximately 84% was generated in NSW, VIC and QLD. The Commercial & Industrial (C&I) sector, which includes offices, retailers and grocery stores, produced approximately 62%, or 3.6mt.
Due to the relative homogeneity of paper-based products used in this sector (e.g., cardboard boxes and containers), wastepaper generated by the C&I sector is largely recoverable, with 68% recycled in FY19. The relatively low recycling rate among municipal (MSW) wastepaper (46%), however, provides significant opportunity for improvement. Additionally, AustraliaŌĆÖs combined wastepaper recycling rate of 60% is well below the combined European Union and UK recycling rate of 72.5%, pointing to substantial opportunity for improvement in both municipal and C&I (likely to be particularly amongst smaller and medium sized businesses).
Wastepaper by Fate, Australia
million tonnes
3. Import Restrictions by Key Trade Partners
As governments across the world move towards circular economy models for wastepaper, a growing policy effort has been made to restrict the import of waste products. Several of AustraliaŌĆÖs key wastepaper export destinations have enforced significant restrictions on the import of wastepaper, contributing to a steady decline in wastepaper exports.
Wastepaper & Cardboard Exports by Destination, Australia
million tonnes
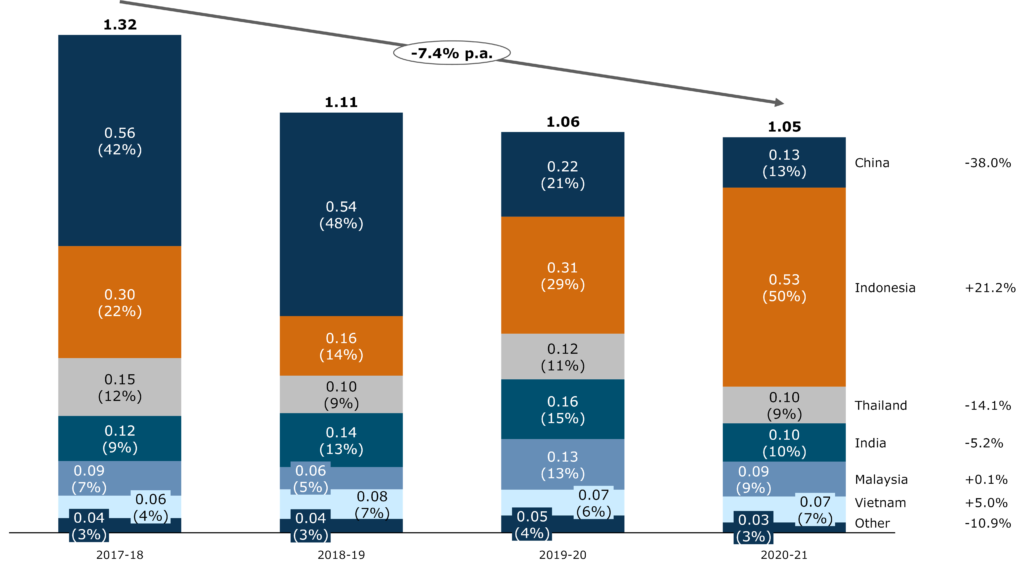
In 2017, China launched ŌĆśOperation National SwordŌĆÖ which placed a rigorous review on the import of most recyclable waste products. Various iterations have resulted in all solid waste imports being banned as of January 2021 (with the exception of a few high-quality materials). Prior to the 2017 announcement, China accounted for 42% of Australian wastepaper exports, but now represents only 13%, a figure which is expected to continue declining.
As Chinese demand for imported wastepaper has waned, Indonesia (with a large paper making industry) has become the largest importer of Australian wastepaper, now accounting for 50% of Australian exports. In November 2019, however, Indonesia also implemented restrictions around the contamination content of imported wastepaper in an effort to support its own recycling industry. As governments continue to restrict trade in waste products globally, waste exporters are likely to see a continued trend of declining exports and an increased need to recycle wastepaper via the circular economy.
4. Shifting Policies and Targets by Australia’s Federal and State Governments
It is not only AustraliaŌĆÖs key trading partners who are enacting stringent restrictions on wastepaper trade. In March 2020, a timetable detailing staggered bans on various waste product exports between 2021 and 2024 was announced by the Council of Australian Governments (COAG).
From July 2024, the export of some forms of recovered mixed paper and cardboard will no longer be permitted. It is estimated that ~444k tonnes, or 42% of current exports, will be impacted by the ban. In response, Federal and State governments have committed significant funding to the Recycling Modernisation Fund (RMF), which will generate over $800m for investment in recycling infrastructure, capacity and technology.
Ambitious waste targets have been set by individual states, targeting increased recycling rates, decreased use of landfill and an overall reduction in per-capita waste:
- NSW: By FY22, increase MSW and C&I recycling rates to 70% and increase landfill waste diversion to 75%
- VIC: By 2025, targeting 72% landfill waste diversion and a 50% reduction in organic waste volume sent to landfill
- QLD: By 2025, reduce MSW waste per-capita by 10% and increase MSW and C&I recycling rates to 55% and 65%
- WA: By 2025, reduce per-capita waste by 10% and increase waste recovery rate to 70%
- SA: By 2025, reduce landfill disposal by 35% and targeting landfill diversion rates of 70% and 80% for MSW and C&I waste
5. Rapid Advancements in Technology and Innovations
Innovative recovery processes and improvements in existing technology will allow more waste to be recovered and diverted from landfill. If wastepaper recyclers are to meet ambitious policy targets related to recycling and landfill diversion, recycling technology will need to be able to handle increased volumes of wastepaper. Visy, one of AustraliaŌĆÖs major paper and cardboard recyclers, recently invested $37 million in a new drum pulping system which eliminates contaminants from wastepaper, allowing Visy to more than double its paper and cardboard recycling capacity in Victoria.
Waste-to-energy recovery is a newer form of wastepaper recovery that is growing in prominence, however as of 2019 it only accounted for 6% of wastepaper use. While no significant waste-to-energy specific facilities currently operate in Australia, a major facility is under construction in Perth and a $600m facility was announced via an Australian Paper and Suez joint venture.
6. Increased Consolidation of Key Participants
We have also seen consolidation and M&A activity among key players as participants reconsider their value proposition along the wastepaper activity chain.
Suez recently divested several physical assets and processes to Cleanaway and Veolia, including waste collection, recycling and landfill operations, in an attempt to position itself as a technology-based services provider in waste management.
Bingo Industries was acquired by Macquarie Infrastructure and Real Assets (MIRA) for $2.6 billion. Remondis also acquired several of VeoliaŌĆÖs and SuezŌĆÖs assets after the ACCC required divestitures related to VeoliaŌĆÖs abovementioned acquisition of Suez assets.
It is likely that further consolidation will occur as the dynamics of the recycling, landfill and international trade markets for wastepaper continue to evolve.
How Mainsheet Can Assist
It is clear that the wastepaper industry will continue to undergo significant changes in the coming years, providing opportunities for existing players and investors.
Mainsheet has significant experience assisting companies to develop value creating strategies in the context of changing markets and business models. For companies seeking to understand their options, Mainsheet can assist in a number of ways, including:
- Creating innovative, distinctive and executable new strategies to respond to market changes
- Working with clients to expertly design and execute value creating transactions
- Collaborating with companies to adopt a fact-based approach to identify and capture operational performance improvement opportunities
Please reach out to us here if you are interested to discuss further.